In the technologies that we implement at INDEVOPS , my colleagues are experts.
Conversation with them is always a solid portion of knowledge, sprinkled with a decent dose of good humor.
Provided that the equipment does not play tricks on us during the recording of the material. 😊😊 Unfortunately, it did.
Well, now let’s have a test from what I remember – as befits the beginning of the school year. 😊
The topic of my assignment. Why is it a good idea to implement OS agents in VMware Aria Operations?
The starting point was my understanding of what an OS or operating system is which Marcin Rzepa explained to me swiftly in a very illustrative way:
- Windows, which I have installed, is my OS
- the remote desktop I run on is also my OS
- the difference between one and the other is that the laptop is the physical infrastructure (I can touch it, move it) while the desktop is my program, where I access and it is my virtualized laptop.
Here we come to another concept: virtualization. Well, virtualization, to put it simply, is to install, for example, multiple Windows on a single server, that is, such a much more powerful laptop.
Readers know more about virtualization than I do, so I won’t elaborate on that 🙂
Well, but what’s the deal with those Agents?
In VMware Aria Operations we have 2 types of agents. For metrics there is the Telegraph agent. For logs there is the Fluentd agent or the native Aria Operetions for Logs agent. The agents allow you to collect metrics and logs, not only from the operating system itself, (because these metrics can be collected by Aria through VMTools – an agent that is built into the vSphere platform that virtualizes OSes) but specifically from the applications installed in it. This provides an easy way to look deeply into our application, and thus we can more easily and quickly detect undesirable situations and errors in it. And since it’s faster, we save time and therefore, money.
This begs the question of why is it easier to troubleshoot by adding an agent to the OS?
On the one hand, VMware Aria Operations monitors and collects information from the physical infrastructure and virtualization software remotely through plug-ins (management packs and content packs), and on the other hand, we can get additional metrics (indicators) of application performance on that system (thanks to the agent). Meaning to monitor performance (metrics) as well as errors (logs), or even its behavior itself (logs). Behavior, because applications generate logs, you can increase the levels of accuracy of the logs in the application, and the agent captures all this and sends it to VMware Aria Operations, where it is parsed and you can build your own analysis and tracking methods out of this. On top of that, in turn, you can impose appropriate conditions and alarms that are triggered, or just tracked.
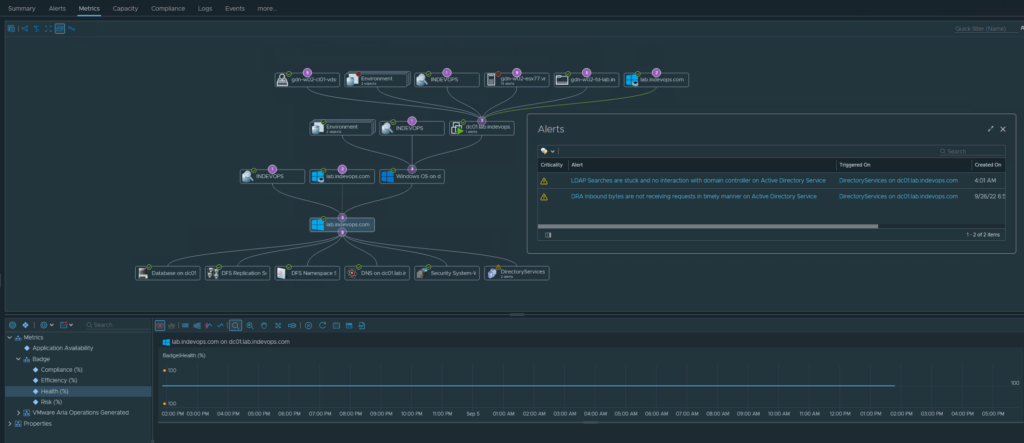
In addition, VMware Aria Operations can automatically build relationships between monitored objects. As we have an agent (Telegraf) such a relationship is also built to the OS on which it is installed. Moreover, if the agent detects application components, it also represents them in Aria. Then the operator has a visualized picture of the application’s architecture in graphical form, i.e. exactly what components the application is built of and can trace the entire path of its dependencies on the other components: databases, virtualization and physical layer. Such visualization is particularly useful when . On the one hand, when the infrastructure fails, we can see if and which applications are affected. On the other hand, when an application has a problem, we can see if and what infrastructure component can affect it.

Example of built relationships between objects
So it’s easier, because see the bigger picture. Data from all plugged-in elements “flows down” into one place. We have visibility into metrics and logs from the entire IT stack.
So what does the full IT picture look like?
By default, Aria has a number of built-in views or dashboards prepared for different types of objects and for different audiences, such as a dashboard that shows in graphical form all virtual machines depending on their CPU load, or a dashboard view of databases across the entire environment (our customer has 500 instances and sees them all on one dashboard).
Additionally, you can create custom dashboards in VMware Aria Operations. This may not be anything extraordinary nowadays, but the extraoridinary seems to us that we at Indevops specialize in listening to our Customers 🙂 and making their dreams come true 🙂
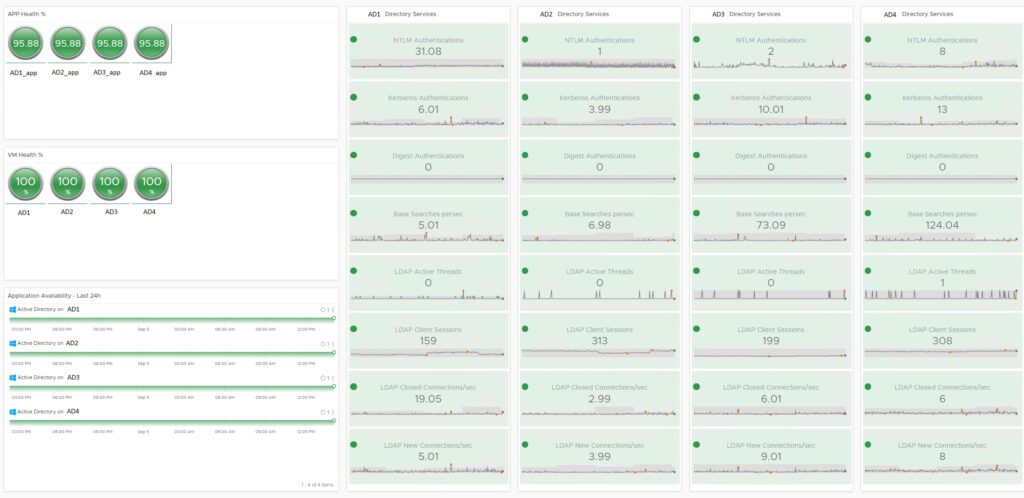
Thus, we have plenty of dashboards which we deliver during our implementations and which allow to look more conveniently and extensively at the monitorised world – from agents to infrastructure.

Example of an application dashboard
I hope I was able to capture and illustrate the topic well 🙂.
If you have any questions, let me know. Our team is ready to meet your needs.
BACK TO NEWS